Scientists utilise satellite images for early detection. By Anna Mouton.
The impact of drought has been front-of-mind for many South Africans in recent years. Agriculture has been hit hard and people have been forced to make do with water shortages — but that has resulted in a new set of problems.
“Farmers are under pressure to use water more efficiently so they irrigate less and less,” says professor Adriaan van Niekerk, director of the Centre for Geographical Analysis at Stellenbosch University. “The less you irrigate, the less you leach salts from the soil and that can become a problem. The other factor that leads to salinisation is waterlogging. If the water table rises, then salts push up into the root zone and affect the plant.”
Past research has estimated that as much as 18% of irrigated agricultural land in South Africa is affected by waterlogging and salinisation. Monitoring the problem has been difficult because it requires analyses of soil samples from across the entire country over several years. Van Niekerk is part of a team of researchers who have developed a new method for spotting salinisation and waterlogging using earth observation.
The new method is called within-field anomaly detection. It works by dividing an area under cultivation — referred to as a field — into small plots — called objects. Vegetation biomass and photosynthetic activity in each object is determined from satellite imaging. All the objects in the field are compared to the average performance of the field. If the vegetation in one object consistently underperforms relative to the entire field, there’s a problem.
“If that problem persists, there has to be a soil issue. It’s not that that area gets less water or different fertilisation or is managed differently,” says Van Niekerk. “So the farmer can go and have a look to see what’s going on.” Extensive soil testing has shown that waterlogging and salinisation were indeed present in three quarters of cases flagged by the within-field anomaly detection system.
The advantage of the within-field anomaly detection system is that accuracy isn’t affected by the type of crop or when it was planted. “That’s the big innovation in our project,” explains Van Niekerk. “Previous research looked at vegetation index over large areas with different crops and they had very little success. In our method we only compare areas within a specific field so it’s all relative.”
The biggest challenge has been anomalies — objects within a field that underperform — that are not due to problems. “The boundary of the field or block has to be very precisely delineated. If the boundary is incorrect and includes an adjacent area that isn’t planted, that area will be flagged as an anomaly. So it’s critical that the quality of the boundary data is good,” stresses Van Niekerk. He hopes that the process of collecting boundary data will be automated within the next five years.
Development and validation of the within-field anomaly detection system was conducted across nine irrigation schemes across South Africa. The work was funded by the Water Research Commission and the project report was published at the end of 2015. “We’ve proven the technology. Now it’s about implementation,” says Van Niekerk. “Our new project is a website where you can zoom in to field or block level and see the problem areas.” The web-based system is hosted by the Centre for Geographical Analysis at Stellenbosch University. Currently it’s available for seven pilot areas throughout South Africa, but the plan is to roll it out to other areas.
Van Niekerk believes that their system is more sensitive than observations on the ground. “We can detect problems that aren’t obvious to someone walking through an orchard. And the earlier you detect a problem, the better your chances of stopping it. One possible cause of waterlogging is leakage in the irrigation system. Or it may be that too much or too little irrigation is causing salinisation.”
Salinisation can be halted with correct management. Van Niekerk cites the example of Vaalharts. “Salinisation was a massive problem there in the eighties and large areas were affected. The state and farmers spent money to install drainage and it had a huge positive impact. Nowadays salinisation is mostly under control there.”
Van Niekerk is confident that the within-field anomaly detection system can assist farmers in combatting salinisation and waterlogging. And with agriculture increasingly under threat from climate change and water shortages, farmers will need every tool at their disposal to manage irrigation and soil quality wisely.
The within-field anomaly detection system in action
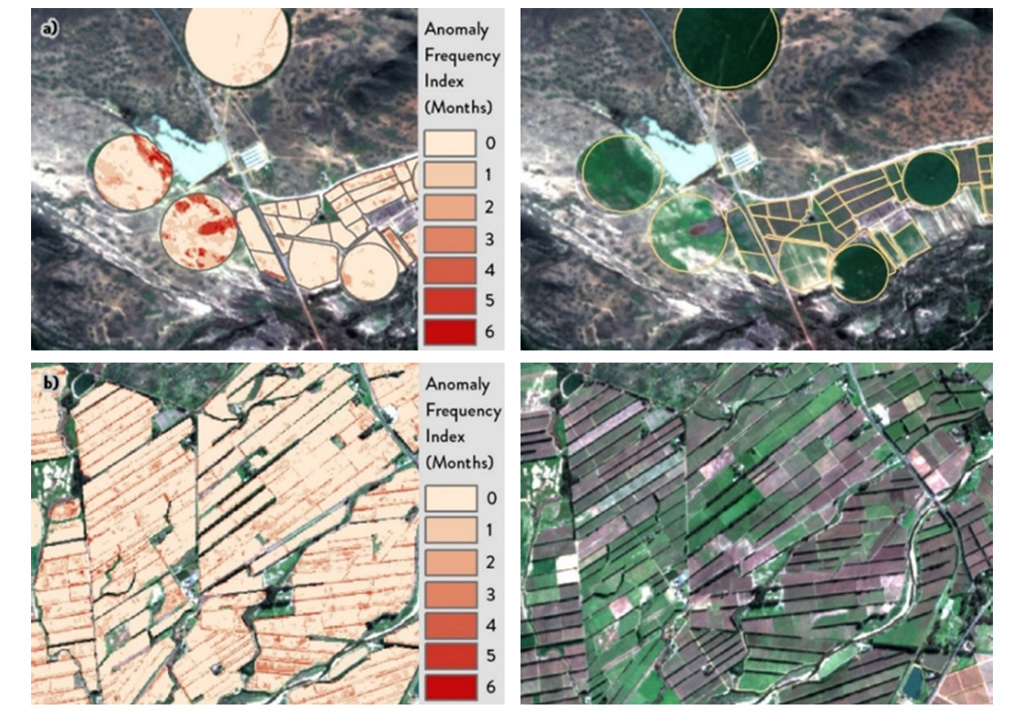
Two different areas are represented by the satellite images in figure 1. The version on the left has the anomaly highlighted in red. The figures give electrical conductivity values measured in soil samples taken from the sites indicated on the images. It can be seen that the values measured within the anomalies are significantly greater than those measured outside the anomalies. High electrical conductivity is an indicator of salinisation. This is an example of how the within-field anomaly detection system can identify salinisation.
Figure 2 is an example of the web-based system in action shows the occurrence of anomalies in a section of the Breede River irrigation scheme. Growers can use the Salt Accumulation and Waterlogging Monitoring System — SAWMS — to identify potential areas affected by salinisation on their own farms. SAWMS is currently available for the following irrigation schemes: Barkly-West, Breede, Cradock, Douglas, Gamtoos, Hopetown, Loskop, Olifants, Oranje-Riet, Prieska, Somerset-East, Sundays, Vaalharts, Vanderkloof.
Images supplied by the Centre for Geographical Analysis | Stellenbosch University
Related Posts:
Salinisation Why does it occur and what can you do about it? By Anna Mouton. "I saw another case of salinisation…
Machine learning in agriculture This branch of artificial intelligence can help pome- and stone-fruit growers extract actionable information from the data deluge. By Anna…
Micro-irrigation at a glance Systems and scheduling with drippers and micro-sprinklers. This article is based on technical information compiled by irrigation specialist Karen van…
Getting to the root of salt tolerance Which stone-fruit rootstock is best for brackish conditions? By Anna Mouton. A new project funded by Hortgro will determine the…
Be savvy about salt Brak management in crop production. By Grethe Bestbier. In South Africa, the term ‘brackish’ refers to any salt-related issues. While…
The drone detective How De Rust Estate uses infrared imaging as a cost-effective tool to identify and address stress in orchards. By Anna…